译者 王为
文中黑字部分为原文,蓝字部分为译文,红字部分为译者注释或补充说明
Forces That Drive Equity Select Sectors
By Erik Norland

Since E-mini S&P Select Sector futures launched on March 15, 2011, their performance can be divided into two parts:
For the first 3-½ years, the sectors moved higher in tandem with a strong positive correlation among them. Some went up more than others but until late 2014, they all went up.
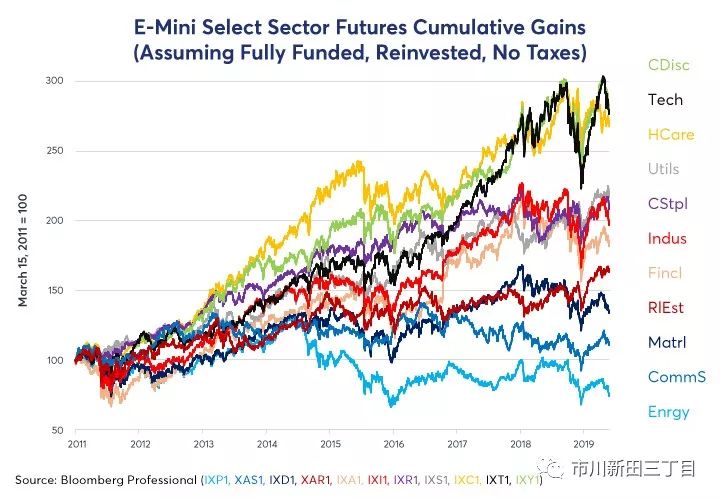
Since late 2014, the sectors have increasingly diverged, with technology, consumer discretionary, and health care dominating on the upside while energy, industrial, and materials underperformed (Figure 1), with a much weaker correlation among the sectors.
自从2011年3月15日标准普尔精选版块迷你指数期货合约登场以来,各类期货指数合约的表现可分为两大类:
1、 在期货指数合约刚推出的前三年半,在上涨较快的各版块的回报率之间存在很强的正关联,虽然一些版块的升幅超过其他版块,但到了2014年末,所有的板块均在涨。
2、 2014年末开始,版块的涨跌表现日益分化,高科技、可选消费和医疗保健行业股票的回报率居前而能源、制造业和材料行业表现垫底,见图1,各板块的表现之间关联程度较以往大为削弱。
Figure 1: Growing Apart: How Equity Sectors Have Diverged.
So, what explains their relative performance? Why did they move almost in tandem until 2014 and why have they diverged since?
那么,应解释各版块表现之间的差异呢?为什么各版块的表现在2014年之前几乎同步而在这之后却开始分化?
This paper answers these questions with a quantitative analysis, calculating the sensitivity (beta) of each of the 11 Select Sector Indices with respect to seven fundamental and financial factors using daily data over eight years. These factors include:
Short-term rates: the one-day change in Fed fund futures expectations one year out.
Long-term rates: the one-day change in the 30Y-2Y (often expressed as 2Y30Y) yield curve slope.
Inflation expectations: the one-day change in the 10Y U.S. break-even inflation spread: 10Y nominal bond yield – the yield on 10Y Treasury Inflation Protected Securities (TIPS).
Equity volatility: the one-day change in the VIX Index of S&P 500® options volatility.
Crude oil prices: the one-day change in the price of West Texas Intermediate Crude Oil.
Industrial metals: the one-day change in the prices of Dr. Copper.
U.S. dollar: the one-day change in the Bloomberg Dollar Index.
为回答以上问题,本文将用过去8年的数据从7个基本面和财务指标等维度出发对11个细分板块指数的敏感性进行量化分析,这些因素包括:
短期利率的水平:一年后交割的联邦基金利率期货的每日报价波幅
长期利率的水平:30年和2年期美国国债收益率之间利差的每日波幅
通胀预期值:10年期美国通胀临界点的每日波幅,10年期美国通胀临界点=10年期美国国债的名义收益率-10年期通胀保值国债的收益率
美股的波动率:标准普尔500指数期权的波动率指数的每日波幅
油价:西德克萨斯轻质原油的每日波幅
工业金属:铜价的每日波幅
美元汇率:彭博美元指数的每日波幅
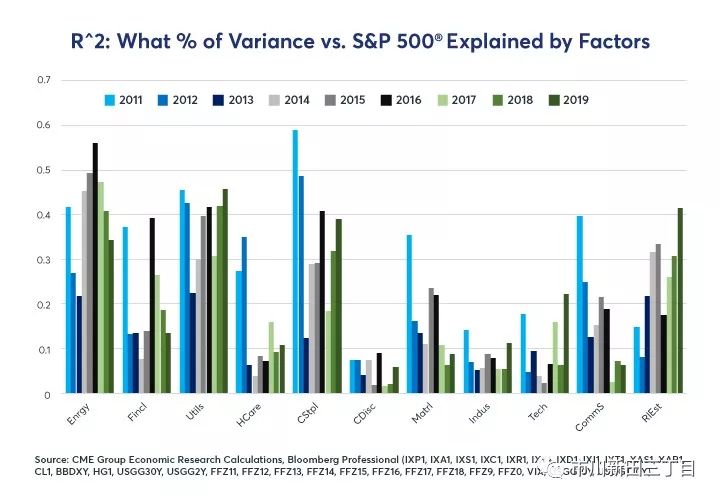
The dependent variable in our regression models is the performance of a given E-mini Select Sector futures contract less the performance of E-mini S&P 500® futures. As such, the focus is on what drives the relative performance of sectors versus the index. Our models explain roughly half of the variance vs the S&P 500 from energy, utility and consumer staples stocks. They explain about one-third of the daily variance in financial services, communication services and real estate and about one-quarter of the variance in materials stocks. Our models have a more difficult time explaining the variance of health care, consumer discretionary, technology, and industrial stocks (Figure 2).
在我们的回归分析模型中因变量用的是迷你精选版块期货合约与标准普尔500指数迷你期货合约的价差。因此,关键是什么因素导致板块的走势与大盘指数之间出现了差异。我们的模型能解释能源、制造业和材料行业与大盘之间几乎一半走势差异的原因,金融、通讯服务和房地产行业与大盘之间三分之一走势差异的原因,材料行业与大盘之间约四分之一走势差异的原因,但很难解释医疗保健、可选消费、高科技和制造业等行业的股价与大盘走势之间存在差异的原因,见图2。
Figure 2: Macroeconomic and Financial Factors Explain Some Sectors Performance Better Than Others.
Short-Term Rates
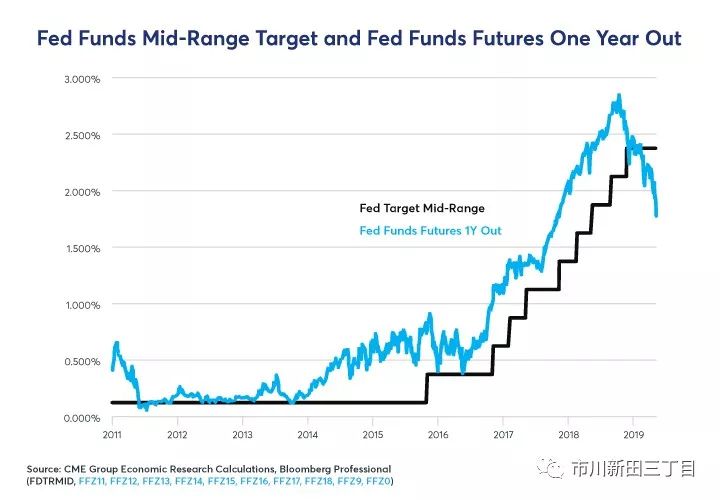
One reason why the various equity sectors turned in reasonably similar performances between 2011 and 2014 was because short-term interest rates barely moved and hence gave very little incentive for any given sector to outperform or underperform the market. That began to change in late 2014 as investors started to anticipate the eventual Federal Reserve (Fed) tightening which began in earnest at the end of 2016. Since then, anticipated Fed rate moves have been on a wild ride with one-year-forward expectations varying from a Fed policy rate of nearly 3% by late 2019 (anticipated in the fall of 2018) to current anticipation of several Fed rate cuts back to around 1.75% by this time next year (Figure 3).
短期利率水平变化的影响
2011至2014年期间,各细分板块的回报表现非常相似的原因是短期利率的水平在此期间几乎没有大的变动,因此任何一个板块几乎均不可能因此而跑输或泡赢大盘。这种情况在2014年末出现一些变化,因投资者开始预期联储终将在2016年末的时候正式开启紧缩货币政策的进程。自那时起,预测联邦基金利率的走势成了一件颇具刺激性的挑战,2018年秋季对一年后即2019年末的联邦基金利率的预测结果未将近3%,而如今市场预测在一年后的这个时候联储将降息数次,将联邦基金利率砍至1.75%,见图3。
Figure 3: Fed Funds Gave Weak Signals Pre-2014, Much Stronger Signals Since.
The various sectors show widely different responses to changing anticipations in the short-term interest rate market. Financial stocks love higher rates, and their beta with respect to Fed rates has increased over time. Banks and brokers suffered during the long period of near-zero interest rates and rejoiced when the Fed began normalizing policy. They are less enthused about the prospect that the Fed might soon cut rates.
美股各版块对短期利率市场的预期变化所作的反应相当分化。金融板块的股票希望见到利率水平升高,该板块的回报率相对于联邦基金利率波动的贝塔值随着时间的推移而出现升高。商业银行和金融中介机构长期受到近乎零利率水平的困扰,在联储货币政策走向正常化后重获新生,他们非常不希望见到联储在短期内重启降息。
Utility and especially real estate stocks trade in the opposite manner. Utilities pay high dividends and trade a bit like bonds: low interest rates increase the net present value of their future cash flows; high interest rates do the opposite. For real estate, low interest rates encourage consumer borrowing, lifting the demand for property; high interest rates do the opposite. Both sectors tend to be highly leveraged as well. Consumer staples and communication services stocks show a weaker negative correlation with short-term interest rates while most other sectors appear to be indifferent (Figure 4).
公用事业板块尤其是房地产板块的情况正相反。公用事业板块的股息率很高,其走势很像债券:利率水平下行将提升该板块股票未来现金流的净现值,利率水平上行将导致该板块股票未来现金流的净现值出现缩水。对于房地产板块来讲,利率水平的降低将促使消费者更多地借贷,从而提升对房地产的需求;而利率水平上升所起的作用正相反。必选消费和通讯服务业的股票走势与短期利率的变动之间呈现较弱的负相关关系,而其他大多数行业的股票走势与短期利率的变动之间的关联度似乎不太明显,见图4。
If Fed fund futures expect 100 basis points (bps) more in rate hikes over the next year, Financial stocks might outperform by as much as 7%, all else equal, while utilities and real estate stocks might underperform the S&P 500® by 10% or more.
如果联邦基金利率期货合约的报价显示市场预测未来一年联邦基金利率的水平将上升100个基点,金融板块的回报率超出大盘的幅度将高达约7%,如果其他条件不变,公用事业和房地产板块的回报率落后于标准普尔500指数的幅度有可能达10%甚至更高。
Figure 4: Financial Stocks Love Higher Rates, which are the Bane of Utilities and Real Estate Shares.

Long-Term Rates
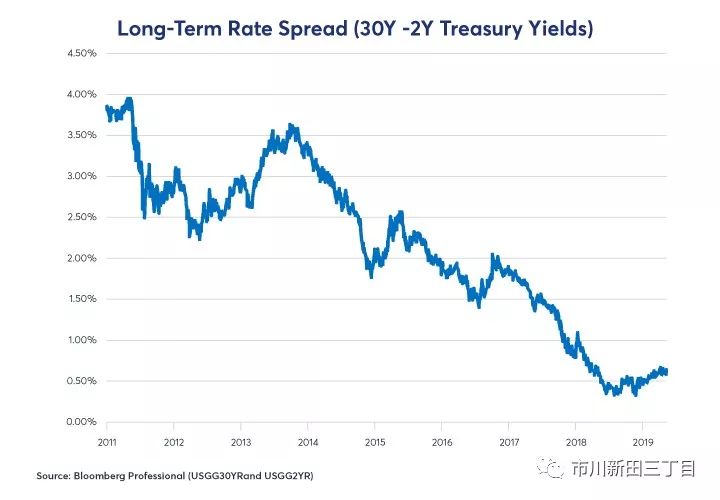
It’s a similar story for long-term interest rates. To minimize multicollinearity, we observe long-term interest rates as a spread over short-term interest rates by taking the yield on the 30Y U.S. Treasury and subtracting the yield on the 2Y U.S. Treasury (Figure 5). The flattening of the yield curve explains to some extent why financial stocks didn’t perform especially well after the Fed began lifting rates. On the one hand, higher short-term interest rates were good for banks and brokers’ profits. On the other hand, a flatter yield curve narrowed the banks’ margins on long-term loans. Industrial firms have a weaker positive sensitivity to the yield curve slope: a steep yield curve is a harbinger of strong future economic performance; a flat yield curve often signals the opposite.
长期利率水平变化的影响
长期利率与短期利率水平变化的情况很相近。为尽可能减少多重共线性因素的影响,我们将长期利率视为是在短期利率的基础上加上一个利差,具体做法是从30年期美国国债的收益率中剥离出2年期美国国债的收益率,见图5。国债收益率曲线的平坦化在某种程度上能解释为什么金融板块的股票在美联储刚开始加息的时候表现得不怎么好。另一方面,短期利率水平的走高有助于提高商业银行和金融中介机构的盈利水平。此外,国债收益率曲线的平坦化将导致商业银行长期贷款的利差出现缩窄。制造业企业的股价与国债收益率曲线的形态之间存在较弱的正相关关系:国债收益率曲线陡峭化预示着该板块的股价未来将有强劲的表现;国债收益率曲线如果出现平坦化则情况正好相反。
Figure 5: Long-Term and Short-Term Rates Have Converged to the Detriment of Financial Stocks.
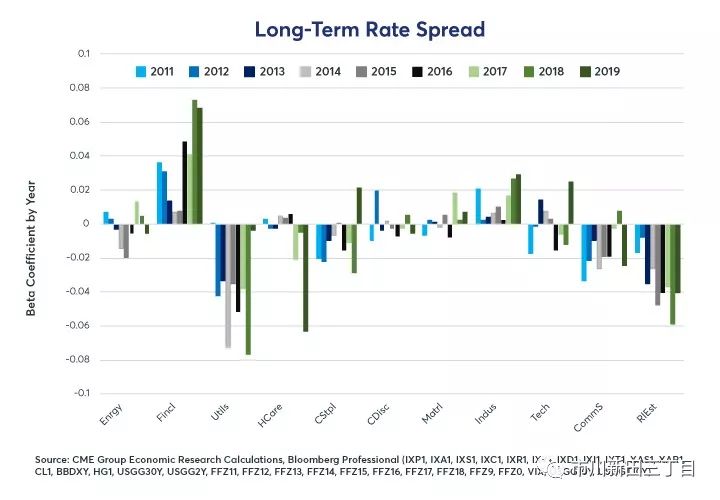
Utilities, real estate, consumer staples and communications services stocks respond negatively to yield curve steepening and positively to yield curve flattening. For these companies, higher long-term interest rates are no better than higher short-term rates. In recent years, health care stocks have also begun to show a negative beta to the yield curve as well. The other sectors appear to be largely indifferent to the relative level of long-term interest rates (Figure 6).
公用事业、房地产、必选消费和通讯服务业等板块的股价与美国国债收益率曲线的陡峭化形态之间是负相关关系,与美国国债收益率曲线的平坦化形态之间则呈现正相关。对于这些行业中的公司来说,短期利率水平的走高所带来的利好要超过长期利率水平的走高。近年来,医疗保健行业的股价波动与美国国债收益率曲线的形态变化之间也开始呈现负相关关系。其他行业板块的股价回报率似乎与长期利率所处的水平没多大关系,见图6。
Figure 6: Financials Like a Steep Yield Curve; Utilities and Real Estate Sectors, Not so Much.
Inflation Expectations
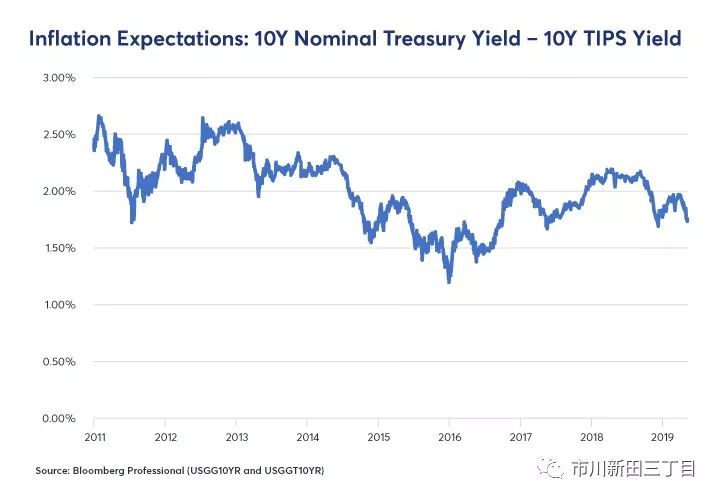
We measure inflation expectations as the difference between the yield on the nominal 10Y U.S. Treasury and the yield on 10Y Treasury Inflation-Protected Securities (TIPS) (Figure 7).
通胀预期的影响
我们将通胀预期值定义为10年期美国国债的名义收益率和10年期通胀保值国债收益率之间的利差,见图7。
Figure 7: 10Y Inflation Expectations Have Varied Between 1.3% and 2.7% since 2011.
Changing inflation expectations also exert an influence on the sectors’ relative performance. Higher inflationary expectations are typically quite negative, particularly for utilities, consumer staples and real estate as they imply the likelihood of higher short-term interest rates in the future. For energy and materials stocks, the causality probably works in reverse. Higher oil and metals prices cause a widening of inflation expectations which benefits holders of energy and materials stocks as well as the owners of inflation-protected U.S. Treasuries relative to the owners of non-inflation-protected (nominal) Treasuries (Figure 8).
通胀预期的改变也会影响各版块股价的表现。通胀预期走高通常会带来相当负面的影响,尤其对公用事业、房地产、必选消费等行业来说,因为通胀预期走高预示着未来短期利率的水平会上行。对于能源和材料板块的股票来说,情况可能正相反。油价和金属价格上涨会导致通胀预期的上行,从而利好能源和金属行业股票的投资者,同时也会利好通胀保值美国国债而不是普通的美国国债的持有者,见图8。
Figure 8: Utilities, Consumer Staples and Real Estate Stocks Don’t Like Higher Inflation.
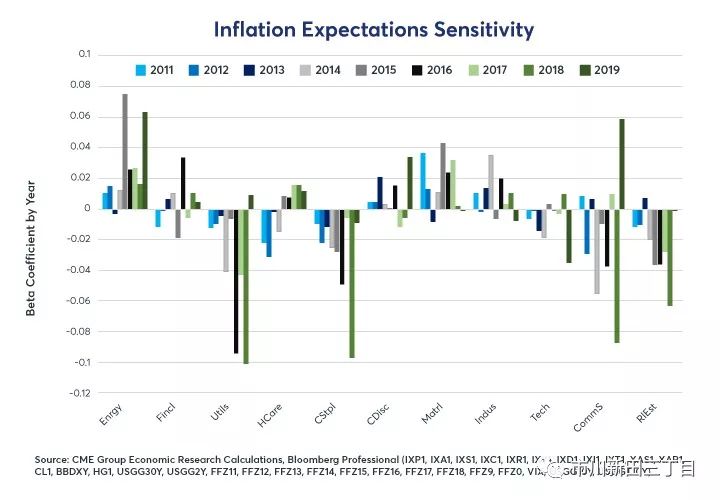
Utilities, consumer staples and real estate stocks tend to show a negative sensitivity to increased inflation expectations. For them, higher inflationary expectations are a harbinger of expectations for tighter monetary policy (or, absent that, higher long-term interest rates) in the future. A 100-bps rise in inflation expectations could send utility stocks as much as 10% lower versus the index and would likely pull down real estate and consumer staples stocks by smaller amounts.
公用事业、房地产、必选消费等行业的股价通常与通胀预期值的走高之间呈现负相关关系。对这些行业来说,通胀预期的升高预示着未来的货币政策将收紧或长期限利率的水平将上行。通胀预期值如果上行100个基点将有可能促使公用事业板块的股价回报率跑输大盘指数的幅度多达10个百分点,房地产、必选消费等行业的股价也会受此影响跑输大盘指数,但跑输的幅度将略小一些。
Volatility
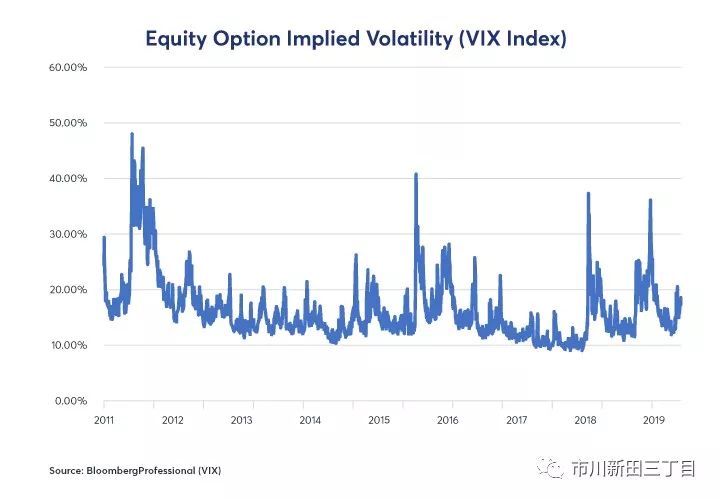
Implied volatility on equity options is highly unstable. After a massive volatility spike in 2011 around the time of the government shutdown and threatened default on U.S. debt, equity option volatility has been extremely subdued for the most part. Since January 2018, however, that has changed as implied volatility on equity index options has begun to creep higher (Figure 9).
美股波动率的影响
美股期权的隐含波动率表现得非常不稳定。在2011年美国联邦政府关门并有可能出现国债违约的时期,美股期权的隐含波动率水平大幅飙升,在那之后的大部分时间里,美股期权的波动率处于极低的水平。但自2018年1月以来,情况有所改变,美股指数期权的波动率水平开始攀升,见图9。
Figure 9: After Years in the Doldrums, Volatility Reawakens.
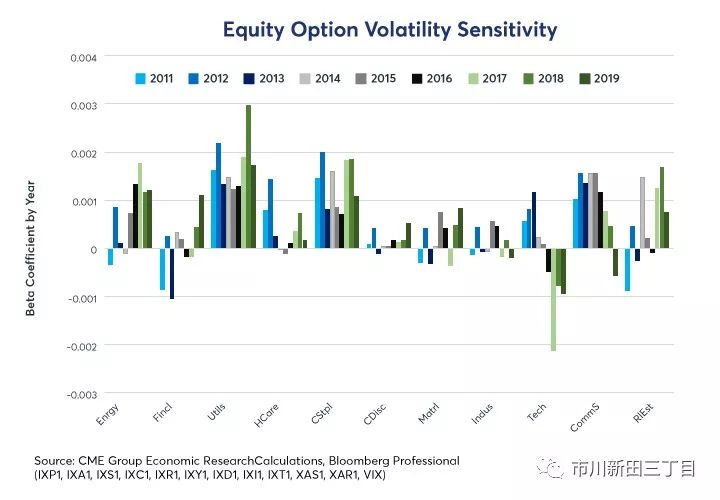
The various sectors show a widely different response to changes in option volatility. Generally speaking, the lower volatility sectors tend to outperform during volatility spikes: these include utilities, consumer staples, communication services and real estate – the same four sectors that show negative sensitivity to higher interest rates and inflation expectations. This is probably because short-term interest rates tend to fall when the equity market tanks and volatility spikes. By contrast, falling volatility tends to encourage higher short-term interest rate expectations. Curiously, energy stocks also tend to outperform during volatility spikes as well.
各版块的股价对美股波动率变化的反应差异很大。总的来看,低波动率板块的股价升幅往往会在美股波动率大涨期间跑赢大盘,这些板块包括公用事业、房地产、必选消费和通讯服务业等,而这四个板块恰好也是股价回报率与通胀预期值的走高以及长期限利率水平的升高呈现负相关关系的板块。原因有可能是因为短期利率的水平通常会在股市下跌以及美股波动率大涨期间出现回落。与此相反的是,美股波动率的下跌往往会导致市场对短期利率水平的预期出现上升。令人感到意外的是,能源行业的股价在美股波动率大涨期间往往也会跑赢大盘指数。
Financial stocks reacted negatively to higher volatility in 2011-13 – memories of the financial crisis were still fresh. More recently, however, financial shares have begun to react more positively to spikes in volatility (on a relative basis to the market as a whole). For technology stocks, the story is the opposite: back in 2011 when tech stocks were, if anything, undervalued, spikes in volatility didn’t seem to bother them much. Over the last four years, as tech stocks soared, they have been hit hard especially when volatility spikes. Herein lies a warning: if tight Fed monetary policy produces a rise in volatility as it has in the past, highly valued tech stocks could be especially vulnerable to declines(Figure 10).
在2011-2013年的美股波动率上扬期间,金融板块的股价出现下跌,当时市场对金融危机记忆犹新。但更近一段时期以来,金融板块的股价开始随着美股波动率的上扬而上行,即相对于整个美股大盘来说。对于高科技行业的股票来说,情况正相反:2011年的时候,高科技板块的股价多少有些低估,因此美股波动率的大涨对该板块的股价影响不大。在过去四年里,随着高科技板块的股价大涨,当美股波动率出现大涨之时,高科技板块的股价遭遇重挫的幅度尤甚。以下为友情提示:如果美联储收紧货币政策像以往一样导致美股波动率上扬,估值水平已高的高科技板块的股价非常有可能出现大跌,见图10。
Figure 10: Tech Stocks are Increasingly Hard Hit During Volatility Spikes.
Oil Prices
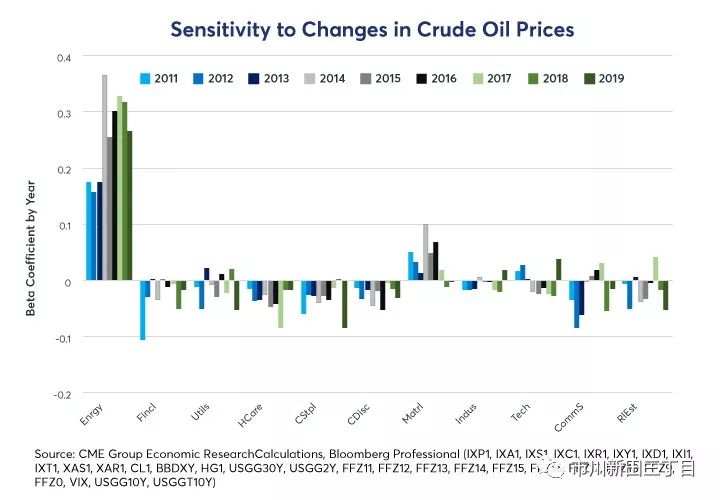
Not surprisingly, oil prices are the dominant driver of the over and underperformance of Select Sector Energy futures. In 2011-13, the beta coefficient on oil prices was around 0.17 – so a 10% rise in oil would likely have produced about a 1.7% outperformance of Select Sector Energy futures with respect to the S&P 500®. Since the crash in oil prices in 2014, that relationship has strengthened to closer to 0.30. As such, a 10% move in oil prices now tends to send energy stocks about 3% higher or lower versus the index (Figure 11). What’s curious is that the energy companies seem to be unable or unwilling to diminish this risk through hedging.
油价的影响
毫无疑问的是,油价是能源板块的股指期货价格跑输或跑赢标准普尔500指数波幅的最主要决定因素。在2011-2013年期间,油价每上涨10%,能源板块的股指期货价格跑赢标准普尔500指数的幅度就会达到1.7%,也就是这两者之间存在0.17的相关系数。在2014年油价暴跌期间,该相关系数升至0.30。因此,如今油价每上涨10%就将导致能源板块的股指期货价格跑赢标准普尔500指数的幅度就会达到3%,见图11。奇怪的是,能源公司似乎未能或不愿意通过对冲的手段消除油价的波动风险。
Materials stocks tend to correlate slightly positively to crude oil prices as well. The other sectors all show a slight tendency to underperform the index in the face of higher energy prices.
材料行业的股价通常也与原油价格的走势略微正相关,在油价上涨的情况下,其他行业的股价走势似乎倾向于跑输大盘的涨幅。
Figure 11: Higher Oil Prices are Good for Energy Stocks, OK for Materials, Not Great for Anyone Else.
Dr. Copper
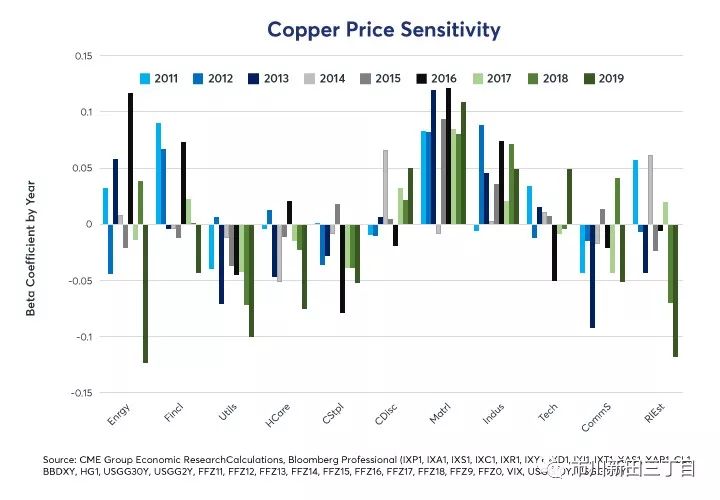
Just as higher oil prices are great news for energy companies, higher copper prices are a boon to mining company stocks, which dominate the materials sector. Higher copper prices are also a positive signal for industrial companies – which is a bit paradoxical since industrial metals are among an industrial firm’s input costs. What matters more than the cost of copper though is the signal that copper sends with regard to the state of the global economy. Higher copper prices signal stronger global growth, especially for China and emerging markets. For industrial firms, that seems to override any cost concerns.
有色金属铜的影响
就像油价上涨对于能源公司来说是个利好一样,铜价上涨也会给材料行业中的老大——铜矿公司的股价带来好消息。铜价上涨对于制造业来说也是个利好,这有点让人难以理解,因为作为工业金属的铜的价格也是制造业企业生产成本的一个组成部分。但是比铜价作为生产成本的一部分更重要的是铜价发出的是与全球经济形势有关的信号。铜价走高意味着全球经济增长势头强劲,尤其是中国和其他发展中国家的势头。对于制造业企业来讲,这个利好程度似乎超过了对铜价走高导致成本增加的担忧。
Likewise, the signal that copper sends about the direction of the global economy also impacts utility, health care, consumer staples, and real estate stocks. Stronger growth isn’t great news for these sectors since it implies the possibility of higher interest rates going forward.
同样,铜价发出的与全球经济走势有关的信号也对公用事业、医疗保健、房地产和必选消费行业的股价产生了影响。经济强劲增长对这些板块得股价来说不是个好消息,因为这意味着未来的利率水平会走高。
Figure 12: Higher Metals Prices Benefit Materials & Industrials Stocks But Not Interest-Sensitive
The U.S. Dollar
A stronger U.S. dollar (USD) tends to be bad news for commodity prices and hence for both energy and materials stocks. Tech firms tend to be more at ease with a strong USD. The other sectors demonstrate mixed and inconsistent responses to changes in the U.S. dollar.
美元汇率的影响
美元汇率走强对于大宗商品的价格以及能源和材料板块的股价来说往往不是个好消息,高科技公司的股价在面对强势美元的时候通常更坦然一些,其他行业的股价对强势美元的反应各不相同。
The U.S. dollar has been a strong currency since 2011, which explains to some degree why oil and copper prices have fallen. Expanding U.S. budget deficits, a likely slowdown in U.S. growth and the possibility that the Fed might ease policy could set the dollar on course to become a weak currency during the 2020s. If that’s the case, it could buffer any negative impacts on energy and materials stocks.
2011年以来美元汇率整体上在走强,在一定程度上可以解释油价和铜价为什么会下跌。美国财政赤字的扩大,美国经济可能出现的减速以及美联储有可能放松货币政策都有可能导致美元汇率在进入2020年代后出现贬值。如果届时情况果真如此,有可能缓解其他因素变化对能源行业和材料行业的股价产生的负面影响。
Summary
结论
Utility, communication services, consumer staples and real estate stocks tend to react negatively to higher short-term and long-term U.S. interest rates as well as anything that might send them higher (increased inflation expectations, higher copper prices and falling volatility). Financial services stocks tend to do the opposite: outperform on higher interest rates and increasingly now on volatility spikes.
公用事业、通讯服务、房地产和必选消费行业的股价一般会对美国长短期利率水平的走高以及任何有可能导致利率水平升高的因素比如通胀预期值的升高、铜价上涨以及美股波动率的回落等做出下跌反应。而金融板块的股价所做的反应往往正好相反,在利率水平升高之时金融板块的股价会跑赢大盘,如今在美股波动率大涨的情况下金融板块的股价跑赢大盘的情况也越来越多。
Energy and materials stocks tend to benefit from higher oil and metals prices, respectively, and both sectors tend to be hurt by a stronger U.S. dollar.
能源和材料行业板块的股价通常会分别受益于油价和金属价格的上涨,这两个板块的股价在美元汇率升值的情况下往往会出现下跌。
Technology stocks largely march to the beat to their own drummer, but they don’t mind a stronger USD and they are becoming increasingly vulnerable to extreme downside performance during volatility spikes (and conversely to bigger-than-average increases in value when volatility subsides).
高科技行业的股价很大程度上按照其自己的规律运行,但美元汇率的升值对其一般没多大影响,但在美股波动率大涨的情况下往往会出现极端的下跌表现,与此相应的是,在美股波动率处于低位之时,高科技行业股价的升幅通常会超过大盘的平均涨幅。
Health care stocks appear to be largely immune from the sorts of macroeconomic factors that we have analyzed here but they can still be strongly impacted by political factors, including efforts at health care reform, that are not covered in this paper. On a purely economic basis, health care stocks are diversifiers from other macro factors: higher rates, a weaker dollar, changing inflation expectations, materials or energy prices; people will want health care no matter what.
医疗保健行业的股价似乎在很大程度上不受文中分析到的各类宏观经济因素的影响,但政治因素对医疗保健行业的股价影响很大,包括计划中的医保改革法案,这个话题在本文中尚未涉及。从纯粹的经济学角度出发,医疗保健行业的股票是多元化投资的理想标的,其一般不受利率水平升高、美元汇率贬值、通胀预期的变化、原材料以及能源价格波动等因素的影响。无论怎样,人们总有投资医疗保健行业股票的需要。
Consumer discretionary stocks are relatively immune from the sorts of economic and financial factors that we have analyzed here. Higher rates, a weaker dollar, increasing oil prices or falling copper prices: the rich don’t care. They continue to consume discretionary items regardless and most of them don’t require credit to do it.
可选消费行业的股票受文中谈到的各类经济和财务因素影响的程度不大.有钱人根本不在乎利率水平升高、美元汇率贬值、油价涨和铜价跌等因素的变化,他们在任何情况下都会继续购买可选消费品,而大多数富人不需要额外借贷即可消费得起。
Lastly, all of the sectors moved together between 2011 and early 2014 largely because none of these macro factors were giving strong signals: short-term interest rates weren’t about to move; the yield curve was steep, energy prices were high but stable as well metals prices and volatility had subsided. The crash in energy and metals prices in 2014-16, the subsequent Fed tightening cycle and the beginnings of a rise in volatility have sent the various sectors on widely different paths.
最后,所有板块的股价在2011年和2014年初的期间里同涨同跌,很大程度上是上述宏观经济因素中的任何一个均未能发出明确的信号,比如短期利率的水平没有在短期内发生变化的迹象,美国国债收益率曲线的形态处于陡峭化,能源以及金属的价格高位稳定运行,美股波动率处于低位。能源和金属的价格在2014-2016年期间遭遇崩跌,自那以后,美联储开启货币收紧周期,美股波动率开始走高等情况的发生导致各版块股价的表现开始出现很大的分化。
版权声明:CosMeDna所有作品(图文、音视频)均由用户自行上传分享,仅供网友学习交流。若您的权利被侵害,请联系删除!
本文链接://www.cosmedna.com/article/778587957.html


